Case Study
Custom business metrics dashboard with multiple data sources
Client Details
The Goal
Inkthreadable came to help solve their data aggregation and visualisation problems. They were tired of manually collecting data from multiple systems, compiling in a sheet and writing formulas every time they needed to get answers from their data.
Their goal was to build a fully automated solution that pulled data from different sources daily, displayed accurate metrics and was easy to read and understand.

“Tribecto created a dashboard displaying data that historically was a chore for us to compile. Thanks to the automation, the report is always up to date with accurate information. We can now use this data to help make better decisions faster, instead of spending time gathering data and writing formulas.”
The Work
We agreed to use a combination of Google Sheet and Google Data Studio to store and present the data. We also used Zapier to integrate the Google Sheet with their other systems like Intercom.
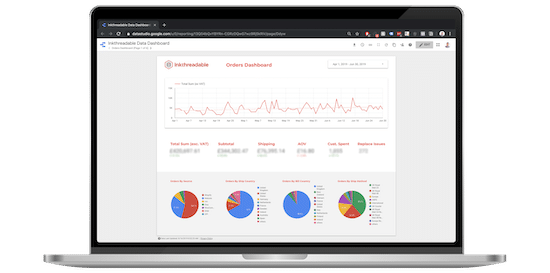
Once we built all the data source connections to the Google Sheet, we tested to make sure there was no missing pieces before starting to build out the visual dashboard in Google Data Studio. We ended with a 6 page dashboard that showed them everything from total revenue to new Shopify users connecting to their platform daily.
The Results
By building this customised, simple to use dashboard the team at incredible are able save many hours per week and make fast business critical decisions that are backed by data.